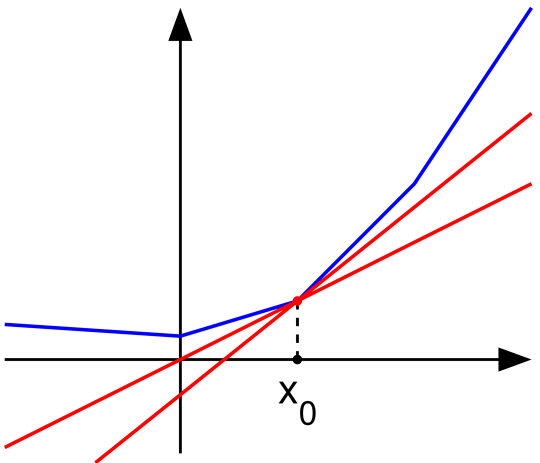
概要
en.wikipedia からコモンズに Maksim によって移動されました。
元のファイルページは
こちら。以下の利用者は全てen.wikipediaに属します。
ライセンス
| Public domainPublic domainfalsefalse
|

|
この作品の著作権者である私は、この作品についての権利を放棄しパブリックドメインとします。これは全世界で適用されます。
一部の国では、これが法的に可能ではない場合があります。その場合は、次のように宣言します。
私は、あらゆる人に対して、法により必要とされている条件を除き、如何なる条件も課すことなく、あらゆる目的のためにこの著作物を使用する権利を与えます。
|
function main() % Subderivative illustration

%  set up the plotting window, and some graphing paramenters
   figure(1); clf; hold on; axis equal; axis off;
   thick_line=2.5; thin_line=2; arrow_size=0.3; arrow_type=1; arrow_angle=20; %(angle in degrees)
   font_size=30; ball_rad=0.04;
   black=[0, 0, 0]; red=[1, 0, 0];

%  define the function; plot the x and y axes and the function
   a=-1.5; b=3; h=0.02;
   X=[a  0 1 2 3]; Y=[0.3  0.2 0.5 1.5 3];
   arrow([a 0],       [b, 0],      thin_line, arrow_size, arrow_angle, arrow_type, black)
   arrow([0, min(Y)-1], [0, max(Y)], thin_line, arrow_size, arrow_angle, arrow_type, black);
   plot(X, Y, 'linewidth', thick_line);

   % the "tangent" lines
   x0=X(3); y0=Y(3);
   s=0.8; plot(X, s*(X-x0)+y0, 'linewidth', thick_line, 'color', [1, 0, 0])
   s=0.5; plot(X, s*(X-x0)+y0, 'linewidth', thick_line, 'color', [1, 0, 0])

   % auxiliary line
   plot([x0 x0], [0, y0], 'linewidth', thin_line, 'color', [0, 0, 0], 'linestyle', '--')

%  graph some suggestive balls
   ball_full (x0, 0, ball_rad, [0 0 0 ]);
   ball_full (x0, y0, ball_rad, [1 0 0 ]);

%   text, sir
   H=text(x0, -0.006*font_size,  'x_0');
   set(H, 'fontsize', font_size, 'HorizontalAlignment', 'c', 'VerticalAlignment', 'c')

   axis(1.1*[a b min(Y)-1 max(Y)])
%  save to postscript
   saveas(gcf, 'Subderivative_illustration.eps', 'psc2')

function ball_full(x, y, r, color)
   Theta=0:0.1:2*pi;
   X=r*cos(Theta)+x;
   Y=r*sin(Theta)+y;
   H=fill(X, Y, color);
   set(H, 'EdgeColor', 'none');


  function arrow(start, stop, thickness, arrow_size, sharpness, arrow_type, color)

% Function arguments:
% start, stop:  start and end coordinates of arrow, vectors of size 2
% thickness:    thickness of arrow stick
% arrow_size:   the size of the two sides of the angle in this picture ->
% sharpness:    angle between the arrow stick and arrow side, in degrees
% arrow_type:   1 for filled arrow, otherwise the arrow will be just two segments
% color:        arrow color, a vector of length three with values in [0, 1]

% convert to complex numbers
   i=sqrt(-1);
   start=start(1)+i*start(2); stop=stop(1)+i*stop(2);
   rotate_angle=exp(i*pi*sharpness/180);

% points making up the arrow tip (besides the "stop" point)
   point1 = stop - (arrow_size*rotate_angle)*(stop-start)/abs(stop-start);
   point2 = stop - (arrow_size/rotate_angle)*(stop-start)/abs(stop-start);

   if arrow_type==1 % filled arrow

      % plot the stick, but not till the end, looks bad
      t=0.5*arrow_size*cos(pi*sharpness/180)/abs(stop-start); stop1=t*start+(1-t)*stop;
      plot(real([start, stop1]), imag([start, stop1]), 'LineWidth', thickness, 'Color', color);

      % fill the arrow
      H=fill(real([stop, point1, point2]), imag([stop, point1, point2]), color);
      set(H, 'EdgeColor', 'none')

   else % two-segment arrow
      plot(real([start, stop]), imag([start, stop]),   'LineWidth', thickness, 'Color', color);
      plot(real([stop, point1]), imag([stop, point1]), 'LineWidth', thickness, 'Color', color);
      plot(real([stop, point2]), imag([stop, point2]), 'LineWidth', thickness, 'Color', color);
   end
元のアップロードログ
Legend: (cur) = this is the current file, (del) = delete this old version, (rev) = revert to this old version.
Click on date to download the file or see the image uploaded on that date.


